
Transport Data Science
Overview
Road accidents are a pressing public safety issue, posing significant risks to human life. Five people die every day on the road in the UK, and 82 are seriously injured on average. The government has been actively involved in making policies to address road safety issues and cut down road deaths. This project aims to provide valuable insights on road safety of motorists and motorcyclists in Leeds using transport data science approaches.
Objectives
To find the accident prone areas on the LSOA (lower super output area) and road level.
To find the most important attributes affecting the level of severity of an accident.
To provide recommendations to policy makers based on the analysis for ensuring safer road travel.
Ensuring that the code is reproducible.
Data Acquisition
Collision and casualty datasets (for 2018-2022) are collected from the “stats19” package and merged aprropriately.
Vector data for roads is extracted from open street maps using an overpass query.
Boundary (LSOA) data for Leeds and population density data are obtained from the Office for National Statistics website.
Road traffic flow data is obtained from the Department of Transport website.
Methodology
We apply hotspot analysis using Getis Ord Gi* statistic to identify the clustering of accidents at the LSOA level. Using the accident count by population density as the target variable for clustering, we classify the LSOAs into 5 distinct categories: “Very Hot”,“Hot”, “Insignificant”, “Cold”, “Very Cold”.
To find the accident prone roads we use the black spot analysis technique proposed by KGM (General Directorate of Highways in Turkey). Using the accident rate and acccident frequency parameter for each road, we compare them to a computed critical value. All roads with values higher than the corresponding critical value are considered as hazardous and unsafe.
We build a classification model using “number_of_vehicles”, “road_surface_conditions”, “road_type”, “urban_or_rural_area”, “speed_limit”, “light_conditions”, “weather_conditions”, “area”, “hour”, and “traffic_calming” as the predictor variables and “accident_severity” as the target variable. The feature importance of each variable is also computed.
Finally we use association rule mining to uncover any “if-then” relationships present in the data. For this we discretize the target variables using appropriate threshold value and carry out the analysis using
aprioripackage in R.
Results
- Most of the car and motorcycle crashes occur along the northern and eastern boundary of Leeds while the central parts of the city witness little to no accidents as compared to the average.

Fig-1: Accident hotspots by population density for Leeds.
- The major highway in the “accident-prone” region was “A6120,” which is the outer ring road between Horsforth and Pudsey. Analysing the road closely, it was found that out of the 303 accidents recorded in the “Very Hot” and “Hot” regions, 101 were located within 10m of “A6120.” Four of these accidents were fatal. Leeds City Council has already introduced comprehensive safety proposals to significantly enhance ‘A6120’ and ensure safer travel.
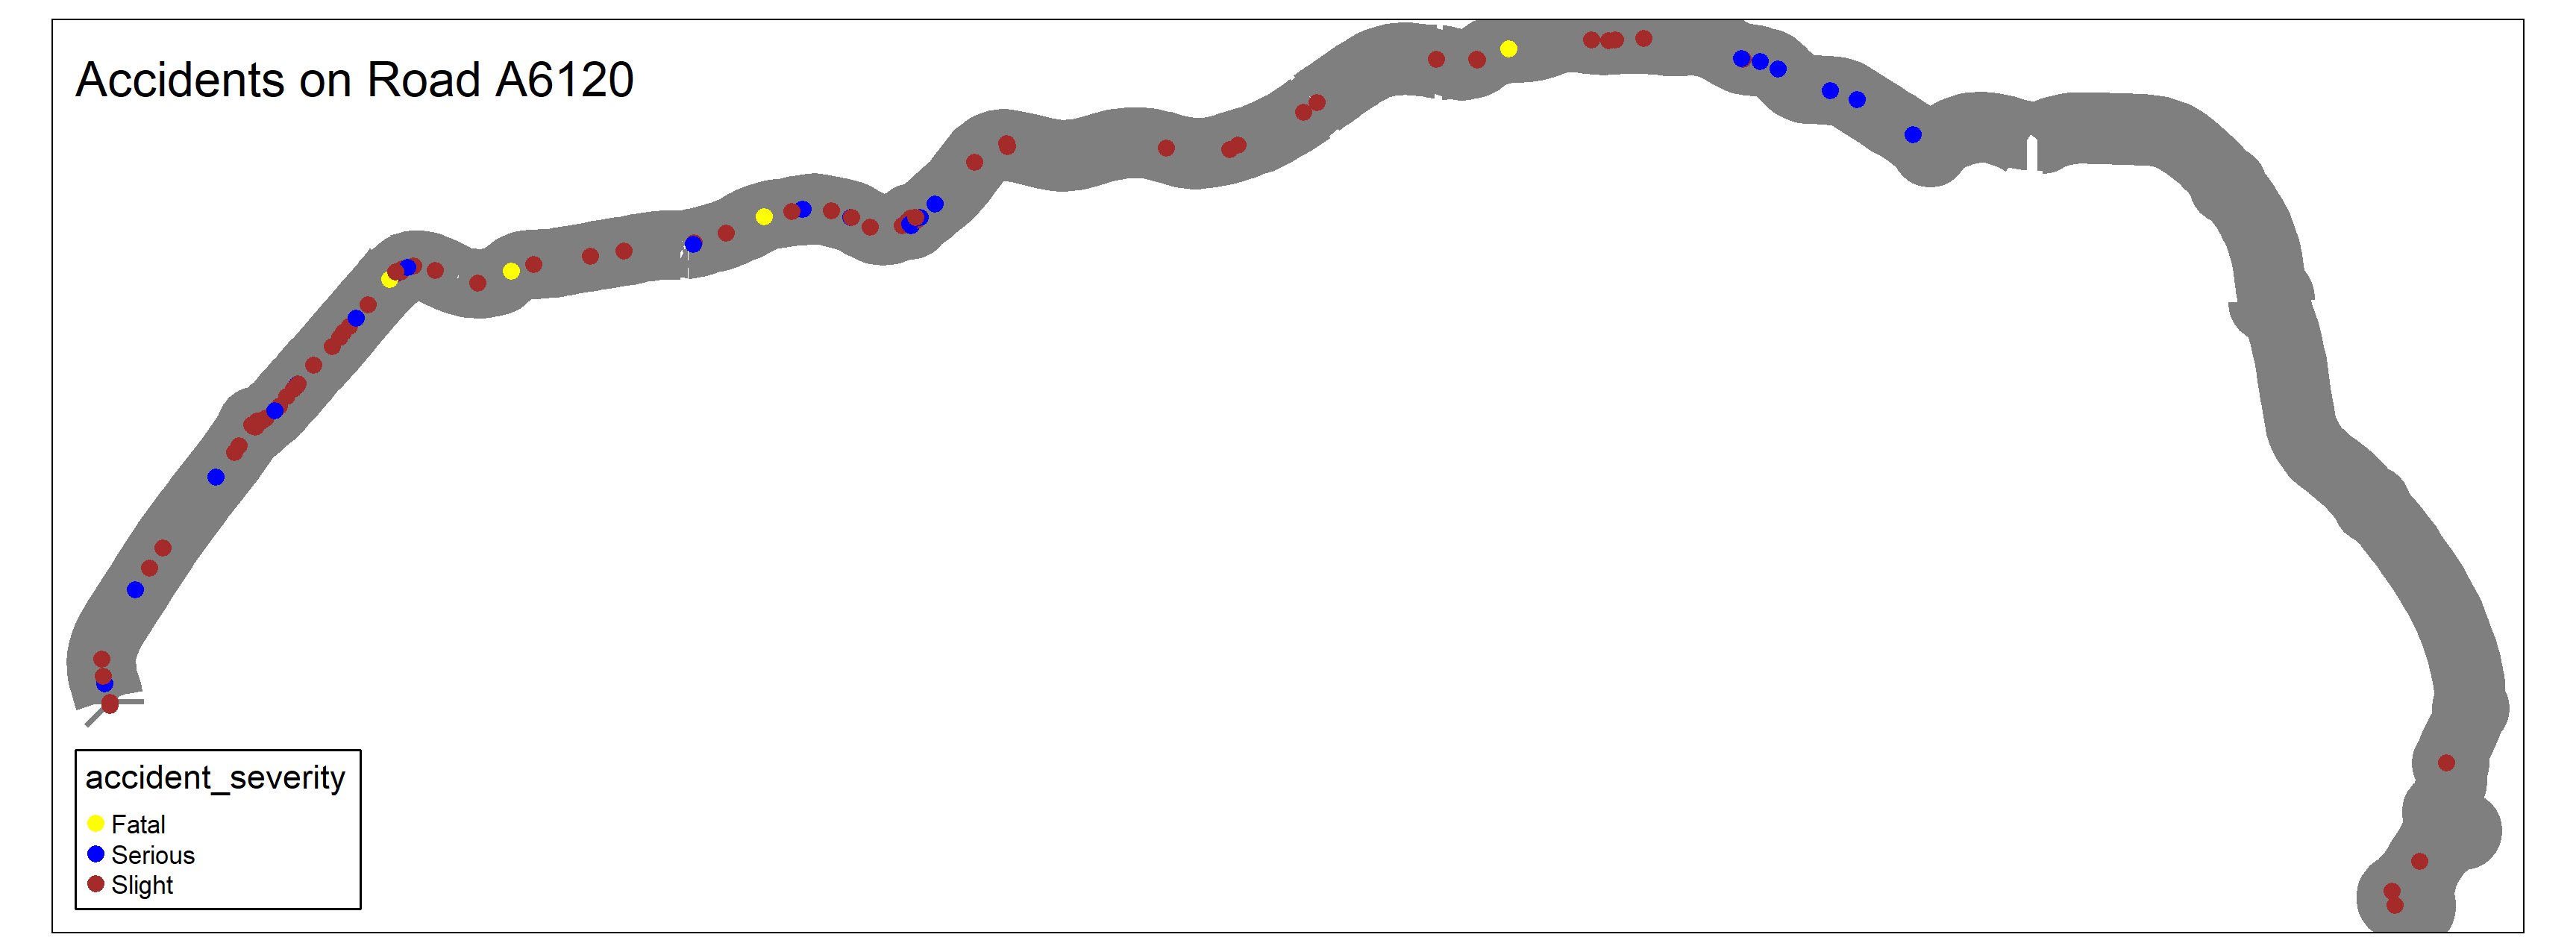
Fig-2: Accidents on A6120.
There were no significant roads in Leeds that could be considered as black spots. Roads with the highest accident count were reported.
The Random forest classification model showed an accuracy of 76.87%. Feature importance for all the variables are shown below.
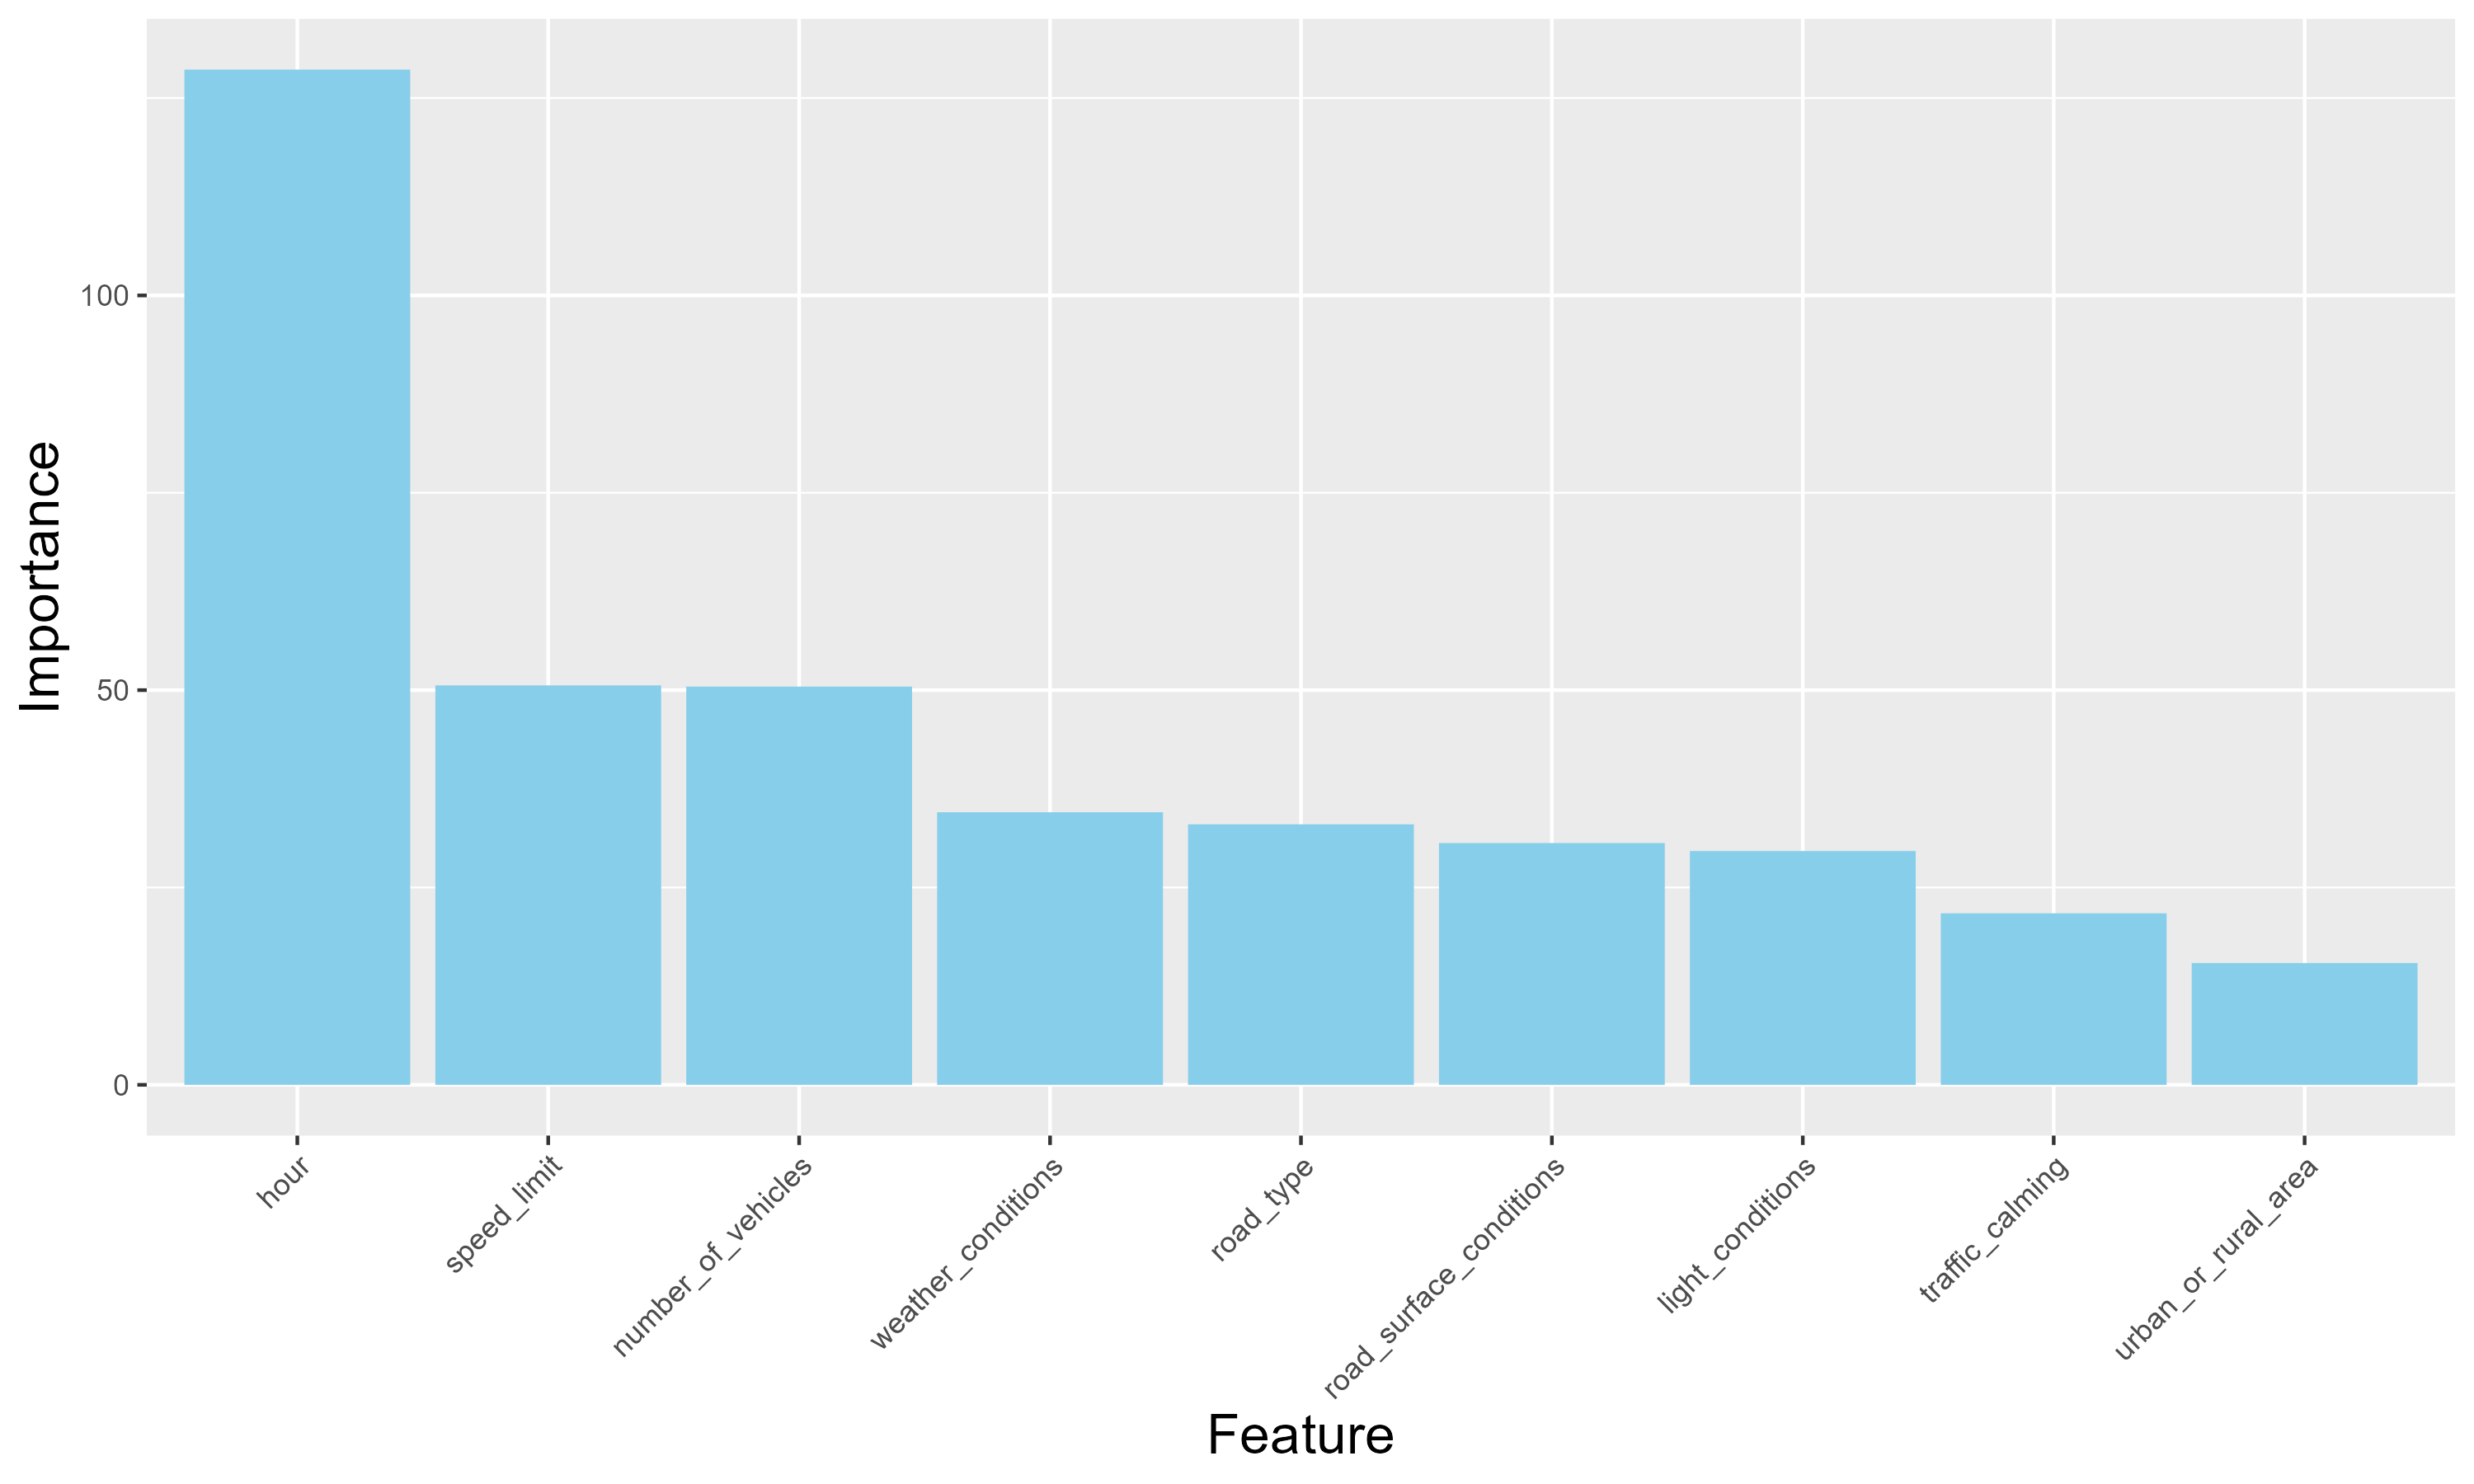
Fig-3: Feature importance for rf classifier.
- Results for association rule mining were shown. It was inferred that if the speed limit was “medium” (25-50 mph), then there is 62.6% support for the accident severity to be “Slight”.
Policy recommendations
The analysis carried out provides an understanding of the distribution of accidents and the factors affecting accident severity. Policymakers can use it to narrow down their target areas and help in optimal resource allocation.
Hotspot analysis reveals that the North-Eastern boundary of Leeds is experiencing a high number of crashes. The road infrastructure and traffic management in the respective areas should be analysed in more detail to come up with effective solutions.
To ensure the ongoing effectiveness of the safety policies implemented, it is crucial that more recent accident data for A6120 Outer Ring Road is thoroughly analysed. This will provide a clear picture of the current situation and guide future policy decisions.
Roads with the highest accident frequency counts should be analysed further to estimate the factors leading to more collisions.
EDA plots reveal that most accidents occur at night. Hence, safety policies should be more focused on enhancing road lighting, increasing night patrols, and deploying reflective markings wherever necessary.
Tech stack used
R (sf, osmdata, dplyr, tmap, spdep)
QGIS
For more details check - https://github.com/utkarsh11252/tds_coursework